1.0 Clinical Dashboard Overview
Clinical Dashboard Overview
Accessing the Clinical Dashboard
The clinical dashboard can be configured to be the page that you see when you log in by a setting in Preferences
Or you can be directed to the traditional interface
In either case you can toggle to the other interface by clicking on the OSCAR-EMR icon in the top left of either page

Fig 1 detail of upper left corner of classic interface
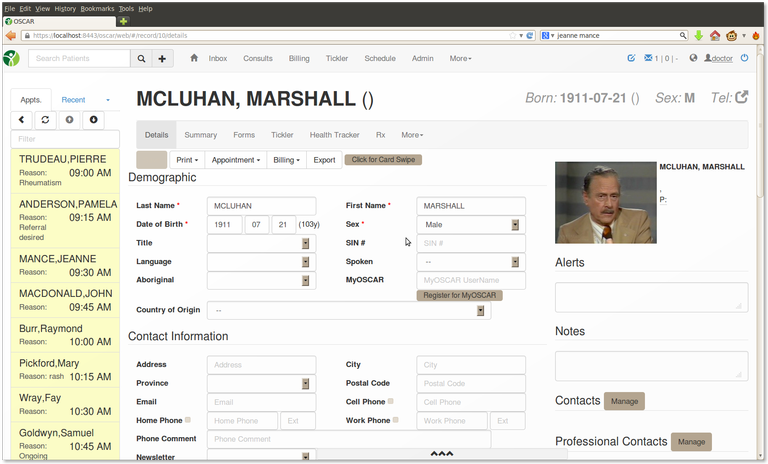
The Clinical Dashboard
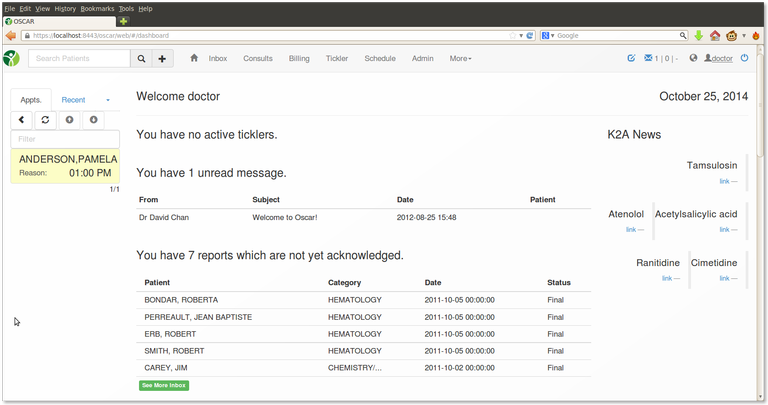
Lucky you , you only have one patient/client scheduled for today, and in the afternoon at that!
Your ticklers are up to date, you only have one message and 7 items in your in-box. There are also five news items in the Know to Act (K2A) news feed.
This only happens when you load the demo data of course
Navigating the Clinical Dashboard
The clinical dashboard can be configured to view different aspects
You can increase or decrease the fonts with [Ctrl]+[+} or [Ctrl][-]
Clinical Dashboard Views: Collapsing the Appointments
You can collapse the appointment or recent access panel with the < arrow

You can expand it again with the > arrow that appears on the collapsed dash

Search / New Demographic
The top left gives you options to search the demographics database
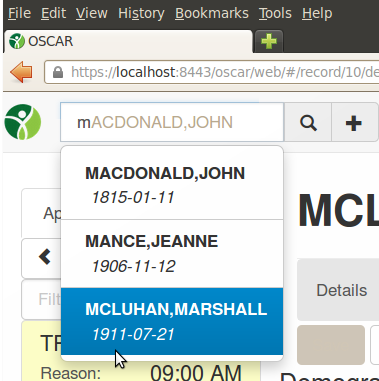
The box lets you search the demographic database against a quicklist that will give you options to select the demographic.
Just type and you will have a selection of names and their dates of birth
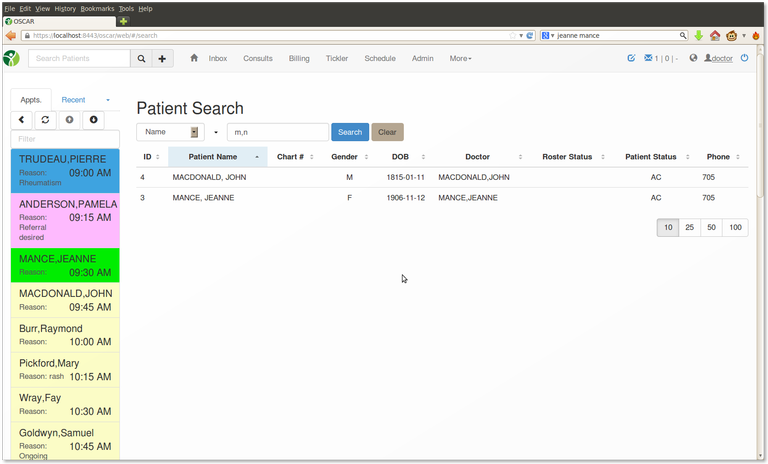
A more complete search is available through the magnifying lens icon
The + icon gives you a quick way to add a new demographic
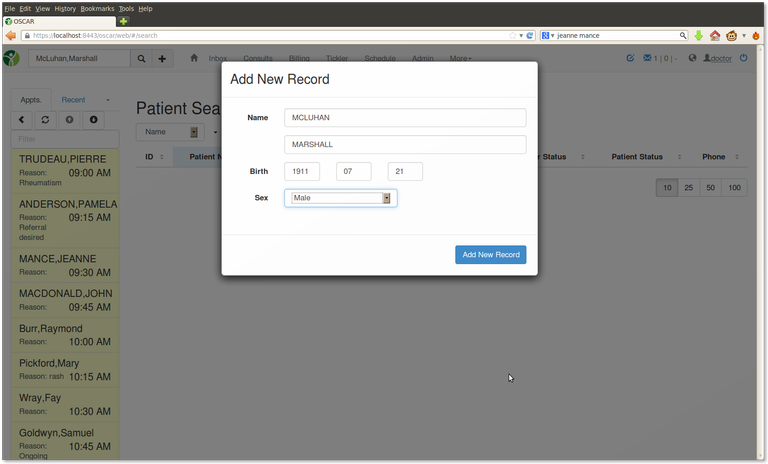
After you add the new demographic you are given the option to add full details
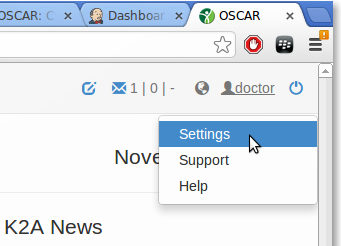
Doctor
The top right gives you options to change provider settings, access contact information and help
Document Actions

